Category: QSL Updates
QSL Updates
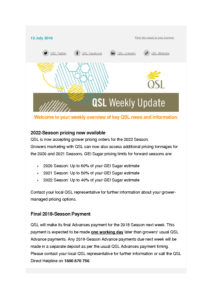
QSL Weekly Update
QSL Weekly Update – ending 12th July 2019
(click to view full size)
QSL Market Update – 8th July 2019
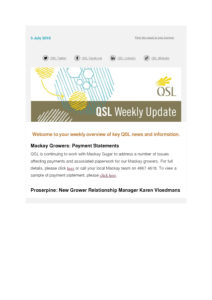
QSL Weekly Update
QSL Weekly Update – ending Friday, 5th July 2019
(click to view full size)
QSL Market Update – 2 July 2019
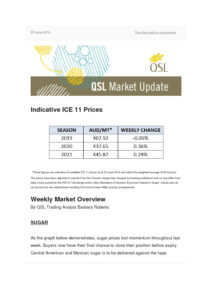
2 July 2019
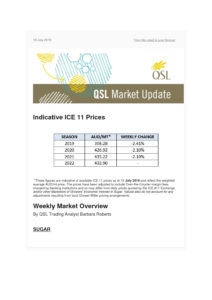
Indicative ICE 11 Prices
2019 – 406.29
2020 – 430.87
2021 – 438.08
*These figures are indicative of available ICE 11 prices as at 1 July 2019 and reflect the weighted average AUD/mt price. The prices have been adjusted to include Over-the-Counter margin fees charged by banking institutions and so may differ from daily prices quoted by the ICE #11 Exchange and/or other Marketers of Growers’ Economic Interest in Sugar. Values also do not account for any adjustments resulting from local Grower-Miller pricing arrangements.
Weekly Market Overview
By QSL Trading Analyst Barbara Roberts
SUGAR
We can officially say goodbye to July19 and welcome October19 as the new prompt contract. Expiry week was busy and volatile, with prices swinging wildly. This can be seen in the ICE 11 price chart below.
• Deliveries were reported at a near record 2 million tonnes of sugar. The biggest surprise was finding 1.1 million tonnes of Brazilian sugar delivered to the tape, when Brazil has been running the highest mix of ethanol for the past 18 months.
o Delivered to the tape?: Buyers and Sellers of ICE 11 sugar futures contracts have until the last day to close out their contract positions on the market. Any buyers/sellers that hold open positions after the final trading session are obliged under the standard terms of the futures contract to deliver or accept delivery of physical sugar and receive/pay the agreed price for the physical commodity.
• 251 mills are currently operating in Brazil. The crush rate is some 7 million tonnes of cane behind last year. Nine mills are about to start their operations over the following weeks which should close the gap.
• Rainfall just before harvest appears to have compromised the sugar content in the cane, currently 4.04% lower than last year.
• 30% of total cane production has been processed which indicates that almost 800.000 tonnes have been already channeled for ethanol production.
Crude Oil: At the G20 meeting, Russia and Saudi Arabia agreed to extend oil production cuts for another 6 to 9 months to support crude oil prices. The crude oil price is currently trading around $59 per barrel.
QSL Weekly Update
QSL Weekly Update – ending 28th May 2019
(click to view full size)
QSL Market Update
QSL Market Update – ending 25th May 2019
(click to view full size)
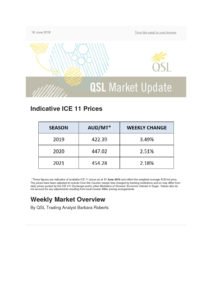
QSL Weekly Update – 25 June 2019
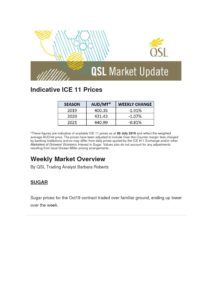
Indicative ICE 11 Prices
*These figures are indicative of available ICE 11 prices as at 25 June 2019 and reflect the weighted average AUD/mt price. The prices have been adjusted to include Over-the-Counter margin fees charged by banking institutions and so may differ from daily prices quoted by the ICE #11 Exchange and/or other Marketers of Growers’ Economic Interest in Sugar. Values also do not account for any adjustments resulting from local Grower-Miller pricing arrangements.
Weekly Market Overview
By QSL Trading Analyst Barbara Roberts
SUGAR
As the graph below demonstrates, sugar prices lost momentum throughout last week. Buyers now have their final chance to close their position before expiry. Central American and Mexican sugar is to be delivered against the tape. Technicals hold the blame for the price drop, as Funds mostly rolled their position to the October contract.
Around the sugar world
• Fundamentals remained stagnant last week.
• India: Maharashtra reservoirs are holding 4% of the total capacity, according to figures from the government’s Central Water Commission.
• Corn prices went up 30% in a month on delays to planting in the US due to rain.
• Brazil is still holding strong ethanol demand and the current corn production problems in the US could possibly shift Brazil’s relationship with the US from an importer to an exporter. This is very bullish for ethanol.
Commitment of Traders: Speculators’ movements for this reporting period were as expected from 127,000 to 100,000 lots. It seems like the specs have moved to the next prompt contract and are impacting prices. This cycle is demonstrated in the following flow-chart:
CURRENCY
• The Aussie Dollar (AUD) kept its same trading range, losing its steam through the week.
• The United States Dollar (USD) was heavily pressured downwards, which is why the AUD was able to hold it together.
It’s all about monetary policies
• The current scenario of trade and global growth uncertainties is forcing Central Banks around the world to discuss their monetary policies.
• The U.S. Federal Reserve held their target range cash rate at 2.25%-2.5% as expected, although at the FOMC (Federal Open Market Committee) meeting 8 of 17 voters forecast cuts before the end of 2019. Apparently The Fed has changed its bias and is waiting for the outcomes from the upcoming G20 meeting between U.S. President Trump and Chinese President Xi. This decision has encouraged the market to increase expectations in regards to rate cuts.
• The shooting down of a U.S. Navy drone over the Strait of Hormuz by Iranian forces has started another war for President Trump. He has levied new sanctions on Iran, although so far that hasn’t impacted oil prices.
QSL Weekly Update
QSL Weekly Update – ending Friday, 21st June 2019
(click to view full size)
QSL Market Update
QSL Weekly Market Update – ending 18th June 2019
(click to view full size)